Introduction
In order for us to explain the WHM control panel features related to the Process Management of your server, we need to make sure you understand what a process is. Basically, you can picture it as being а program or script in action which contains instructions in the form of a code that is read and then executed. Each instruction can be considered as a simple task that the process executes. This script is then displayed as a process that will run until it finishes all of the tasks defined in its code.
Usually, in order for you to see this process, you would need to use the SSH protocol so you can connect to the server and then type a specific command that will list the process. Luckily the WHM control panel offers two functionalities that hold a list of the processes running on the server along with all their associated data. You may use these tools to browse the processes, trace them and even kill them if necessary. Let’s get right into it!
Accessing the Show Current Running Process feature
Step1: Log in to WHM.
Step2: Enter Show Current Running Process in the search bar.
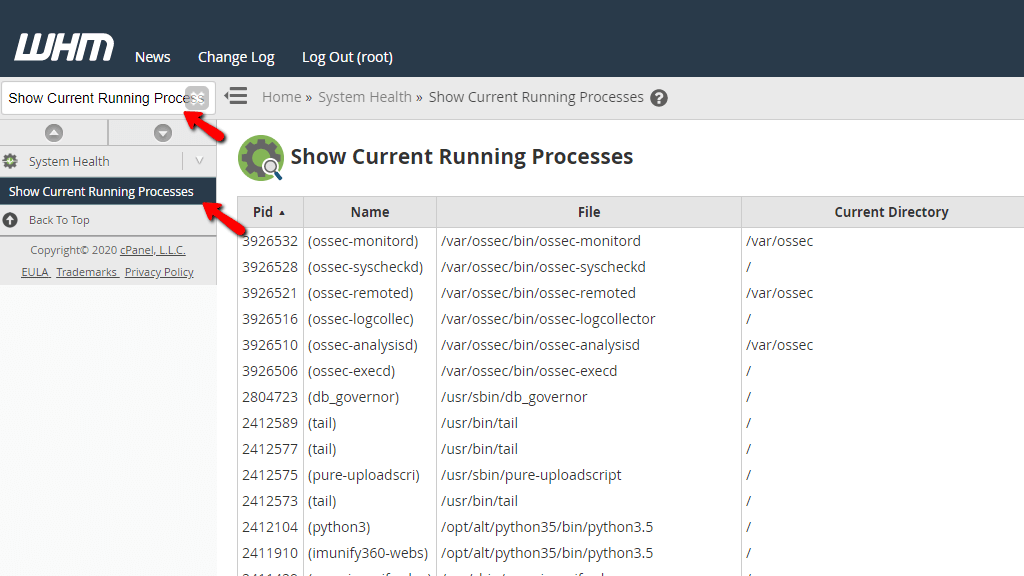
When the functionality shows up below the search bar, please click on it so you can be sent to the “Show Current Running Process” page.
Receive information from the Process List
On the next page, you will notice a table view containing all the currently running processes. When you land on this page, you may feel overwhelmed at first, as the list is quite long. However, you should not worry, as there is a way you can sort it to easily find what you need. In order for you to get a better understanding, we will go through all of the columns and explain what they mean.
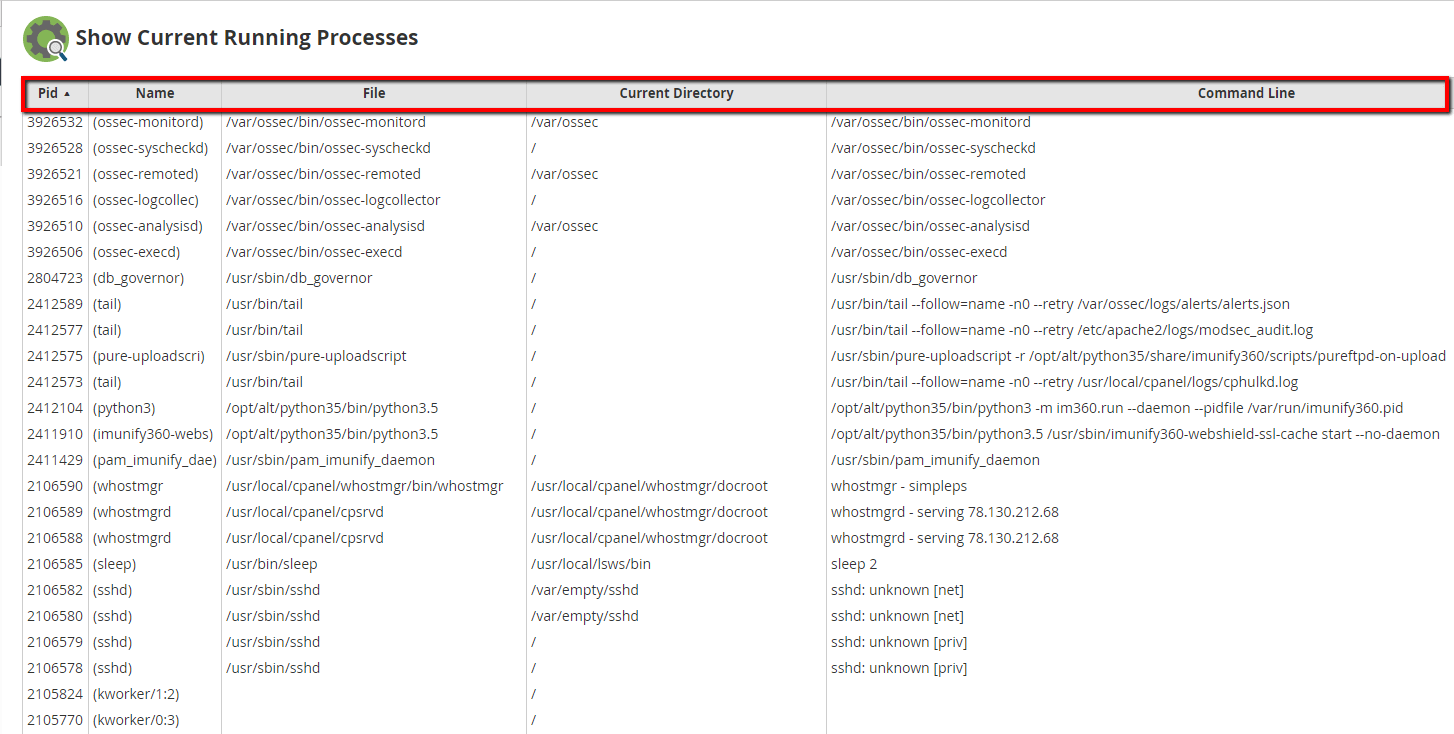
- Pid - This is short for “Process ID”. When a process is spawned, the system will assign a unique identification number to it. By using the Pid column you will be able to obtain the unique id of each process.
- Name - This column will contain the name of the running process.
- File - Displays the absolute path to the file of the application or daemon that started the process.
- Current Directory - Shows the directory in which the process is running. Usually, this is the root (/) directory.
- Command Line - Most programs are started by executing a file (Imagine this as clicking on an icon on your Windows Desktop - a very clear example of that would be either Skype or Viber). Gives information about the command, file, or directory which started it.
As mentioned earlier the table gives you the option to sort data based on the above parameters. All you need to do is click the bolded text on top of the column depending on what you want to view.
For instance, if you are running a PHP-based application - it will be spawning PHP processes shown under the “Command Line” column. If you would like them to appear closer to the top of the table, please click on the “Command Line” bolded text.
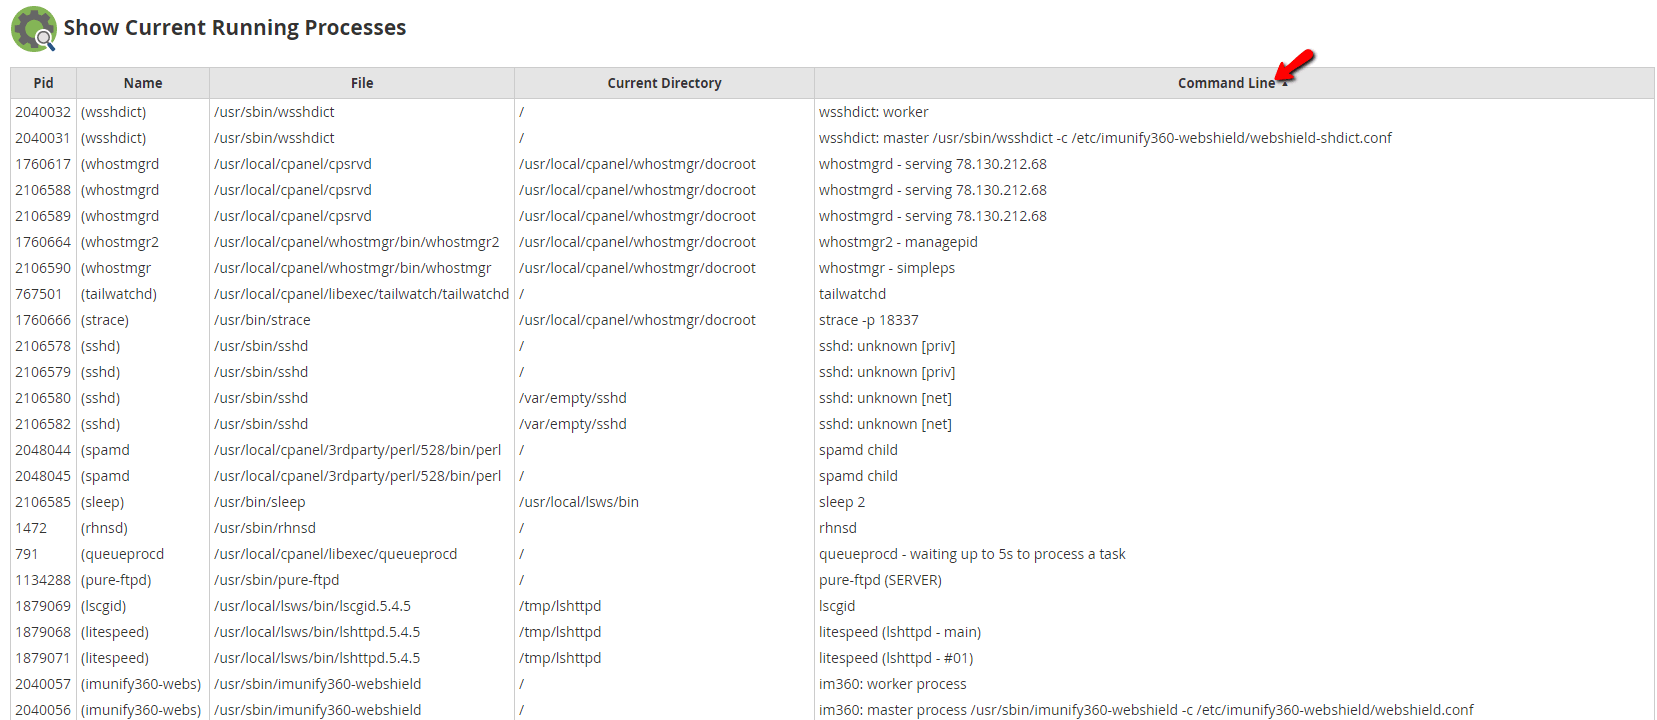
This will make it so it is arranged alphabetically from the last letter in the English alphabet “z” to the first “a”. “p” is much closer to “z”, thus appearing closer to the top of the column, allowing you to easily locate what you are looking for.
Accessing the Process Manager feature
Please go to the search bar on the left side of the screen and type “Process Manager”.
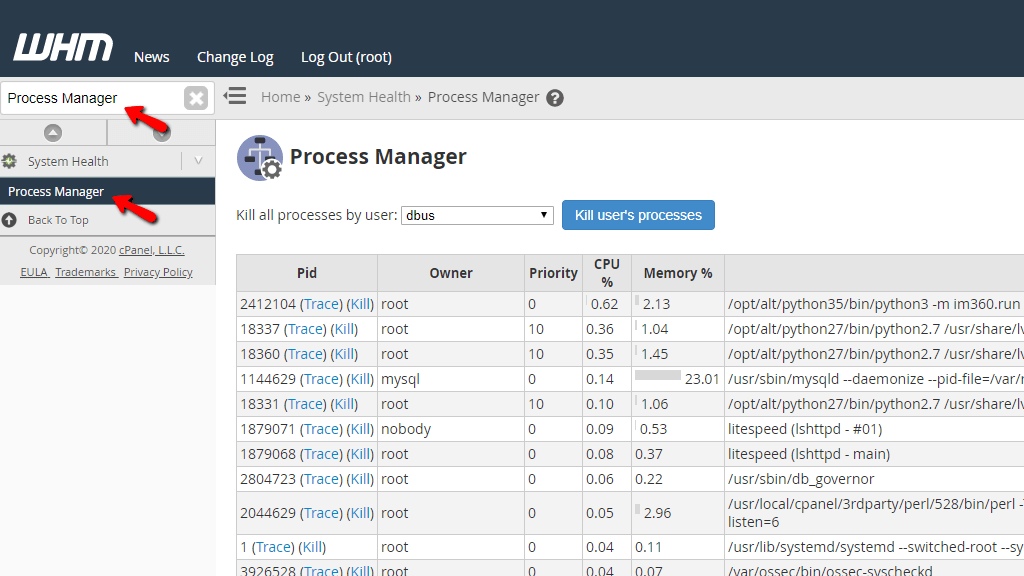
When the functionality shows up below the search bar, please click on it so you can be sent to the “Process Manager” page.
Using the Process Manager in WHM
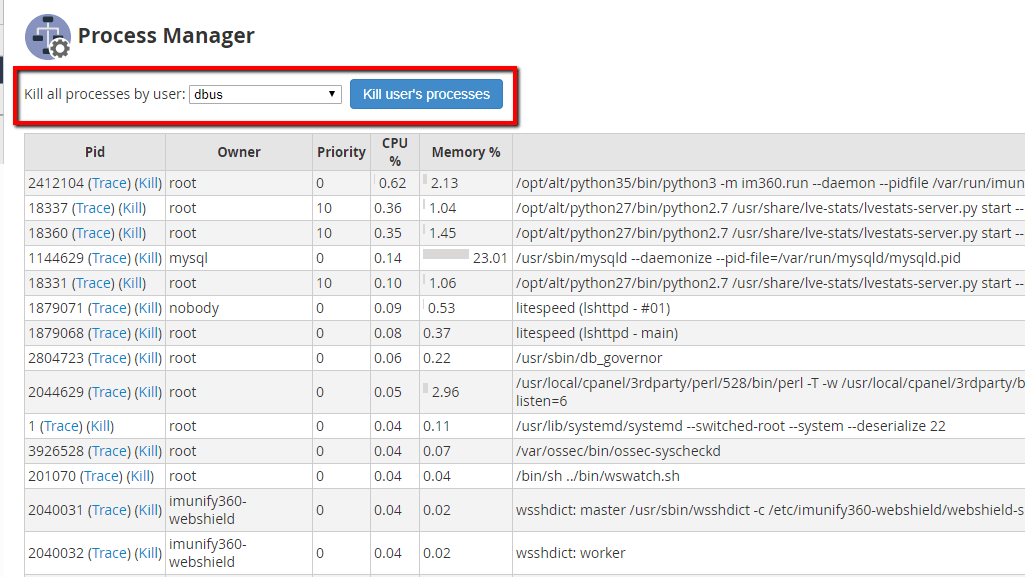
On the top of the screen, right below the “Process Manager” heading, you will see a text “Kill all processes by user:”, a dropdown menu on its right side, and a button labeled “Kill user’s processes”.
Sometimes, a single program can spawn a lot of processes - either because it is being used too much or there is something wrong with it. Instead of having to go through the entire list and kill each process individually, WHM gives you the option to kill the process based on the user who spawned them. An example would be if you have noticed that the incoming email service is being stalled and has spawned a lot of dovecot processes. Click on the dropdown menu and then find the “dovecot” user.
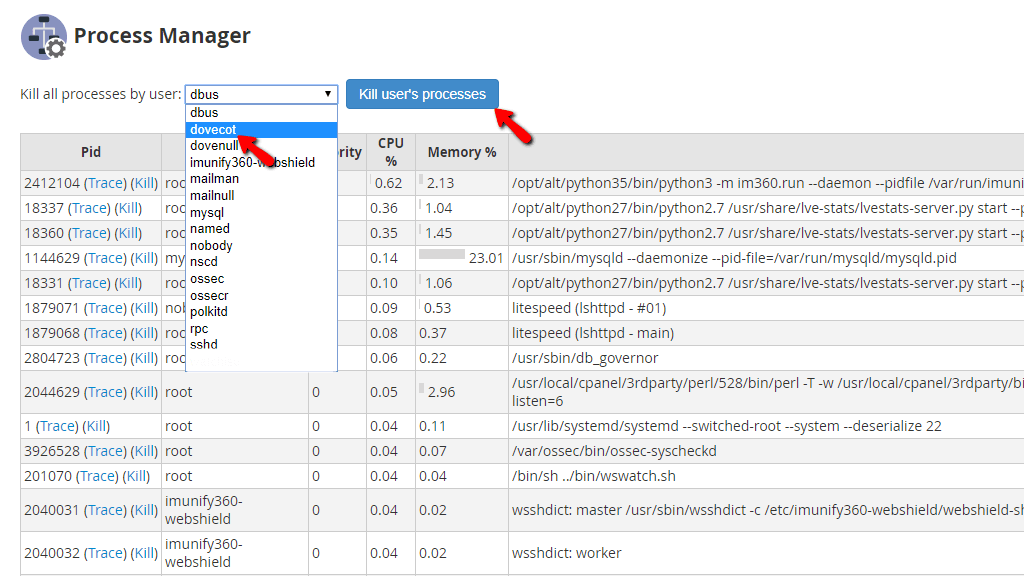
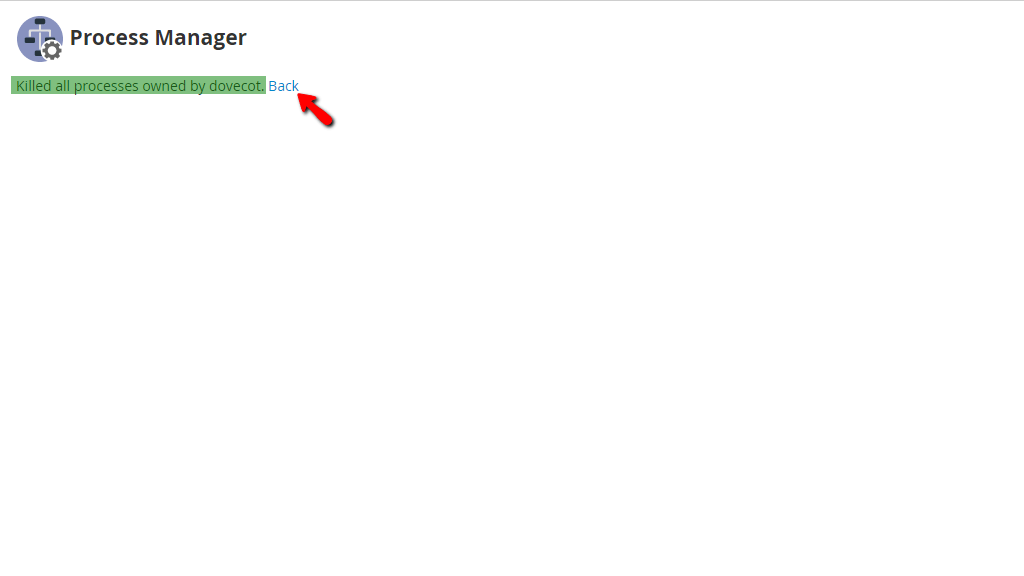
After you have selected it, please click on the “Kill user’s process” button. This will redirect you to a new page, stating that all processes owned by the user in question have been killed. You will also be presented with a blue “Back” link, allowing you to go back to the previous screen.
Underneath, you will find a similar table section to the first functionality, however, this time there are certain columns that were not present earlier. Let’s go through them.
- Owner - This displays the user or system account that started the process.
- Priority - You can picture this as a queue that starts from -20 and goes up to 19. The system will execute the process with the lowest number first.
- CPU % - Shows the percentage of the server’s processing power which the process is utilizing.
- Memory % - Displays the percentage of the server’s memory which the process is using.
Under the “Pid” column, you will notice the blue clickable links “Trace” and “Kill”. The “Kill” link will terminate the individual process. Again, we will use one of the “dovecot” processes as an example.
Once the “Kill” link is pressed, you will be redirected to a page containing information about the process that had been just killed. You will also see a blue “Back” link that brings you back to the previous page if you want to continue with your process killing spree!
The last functionality we are going to discuss on this page is “Trace” which is located under the “Pid” column, preceding the “Kill” functionality.
Each individual process may be traced and this gives output in real-time what is happening during its execution. In this example, we will be tracing the “mysqld”.
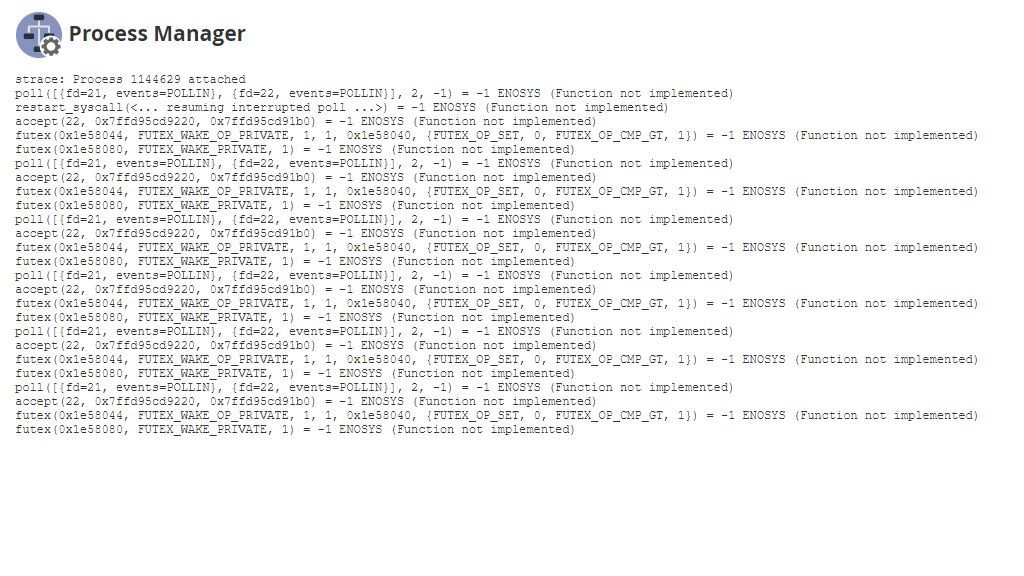
We won’t cover how to read the output, as it a really complex task and you need to have a great understanding of how the service itself works and which part of the output you can use in order to troubleshoot, control, or manage the process.
